ads banger

Saturday, February 27, 2010

New Income Tax Slab in Indian budget 2009

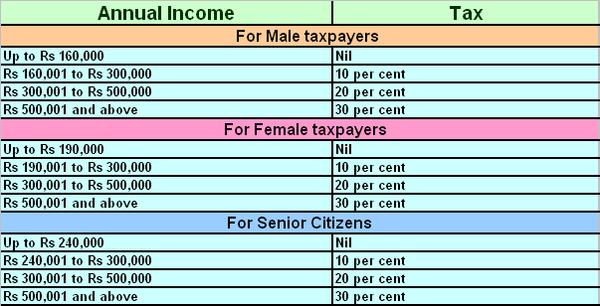
Income TaxYesterday, Pranav Mukherjee presented the annual Budget. This budget has brought some relief for tax paying citizens of India as the budget has increased the basic exemption for individual tax payers by Rs 10,000 for general tax payers and female tax payers and Rs 15,000 for senior citizens (tax payers having age of 65 years and above). Now the current income tax exemption limit has become Rs 1.5 lakh for male tax payers, Rs 1.8 lakh for female tax payers and Rs 2.25 lakh for senior citizens. 10 percent surcharge on taxes payable where the taxpayer’s income exceeded Rs 10 lakhs, is also eliminated. This budget has also raised the deduction for maintenance of medical treatment of dependence from Rs 75,000 to Rs 1 lakh. The finance minister also declared the introduction of Saral-II form which will make tax paying an easy exercise. These are the new tax slabs for Indian Citizens after Union Budget 2009.

New Income Tax Slab


Saturday, January 16, 2010

What is Web Hosting

If you want to take part in the internet as a business, information resource, directory, or as a hobbyist wanting to share data, information and knowledge with the many people and communities on the internet, you have to contain this in a central spot on the internet. You have to own a piece of space in cyberspace.

Web hosting empowers you and anyone with a computer and internet connection to own a piece of cyberspace. In your space, you can have news, bulletins, documents, data, files (your web site) and your own post office (mail server) to accept mail, all in the context of you or your business. This is your space and to get this space you either have to own a piece of the physical internet with a network connection to the internet backbone and computer(s) operating as server(s) offering access to your files and post office, for people on the internet to view your web site or send and receive email with you.

The cost of owning a direct connection to the backbone and a server dedicated to a web site and email is out of reach for the average business and especially general members of the internet. Even running a web site and mail server on your own computer when it is connected to the internet requires a lot of technical ability and knowledge. The internet itself has to be your business for either of these options to be viable.

In our modern society, for every person in business or with a career in most industries today, it is imperative to have a place in cyberspace, not just to be competitive but to survive. web hosting companies were born out of this great need to provide an environment for the masses to own a piece of cyberspace, to offer an environment where people could have their piece of cyberspace on the internet 24/7 without the great cost. web hosting companies developed a model where they could split up areas on the servers connected to the backbone and ?rent? this space, cutting the costs across many people sharing the server and backbone connection to the internet.

In a web-hosting environment, you are offered a web site to place your files, data, documents, and bulletins for people to access with their web browser and an email server for you to send and receive email messages. The web host will also provide you a means to get an address for people to get to your web site with a web browser and post email to you.

To obtain space in a web hosting environment you become a member and agree to terms and conditions of renting the space ? just as if you were to rent a house or commercial premises for your business. Once you agree and become a member, you are given an access code, a key, to your piece of cyberspace. This key, in the form of a login and password, allows you to connect to the web hosting server and up-load (transfer to) your web site so it can be accessed on the internet. Your login and password is also used to connect to a mail server to create and administer mailboxes to send and receive email for you, your staff, or family members.

Just like when you rent a house or commercial premises for your business, you have so many rooms, bathrooms, and floor space to use. In a web-hosting environment, your area is defined as disk space and network transfer.

Disk space is measured in Megabytes (MB) or Gigabytes (GB). Megabyte roughly means 1,024,000 characters and Gigabyte roughly means 1,024 Million characters. Imagine a character as one key on your key board. These amounts determine how many files, documents, or data you can have on your web site.

Network Transfer is also measured in Megabytes or gigabytes which determines how much data (how many of your files, documents or data) can be downloaded (transferred to) people accessing your web site. The more people, or the more data each person accesses on your web site the more data is transferred on the network.

The more disk space and network transfer you use the greater percentage of the web-hosting environment you are using ? therefore the higher the rent.

Just as no office building and home is the same, neither is every web-hosting environment. Some offices have stairs, others have lifts, some houses have ensuites, swimming pools, and gardens, ? and others do not. Web-hosting environments are much the same, some offer bare structures to do just the basics and others offer an array of features and facilities to help you do just about everything you could ever need or want. Some of the features and facilities likely to be offered are ranges of software to use, components, databases, and server side script processing.

The similarity of renting an office or home to renting space in a web-hosting environment is even more similar. With some buildings a gardener and/or a guard is available to look after the gardening or provide security. In a web-hosting environment, you have support people to help you do what you need to do on your web site to make it grow and there are server administrators to protect and secure your web-hosting space.

When you rent a building there are key parts needed to work or live in the space, like rooms, offices, kitchens, toilets, and bathrooms. In your web-hosting environment, you will find equally important components that are required to make the space workable. The core components in a web-hosting environment are:

Web Server

The web server is a relatively simple piece of software that accepts requests over HTTP (Hypertext Transfer Protocol) and delivers HTML pages and Image files.

FTP Server

FTP is the means of which a web master can transfer files to and from the server. To put your HTML and image files on a server you will generally use FTP to upload (transfer to) your files to the server running the web server.

Mail Server

The mail server consists of two parts POP (Post Office Protocol) and SMTP (Simple Mail Transfer Protocol). POP is where email is received into your mailbox and SMTP is what is used to send and receive email between mail servers.

Database Server

If you are using server side scripting on your web server (you use something like Microsoft Internet Information Server) then instead of providing ?static? data only on web pages you can provide data from a database allowing your users to search and view the data in different and dynamic way. Also, a Database server is used to gather data from visitors to your site; orders, feedback, discussions and the like.

Each one of the above components are software programs running on servers in the web-hosting environment. You can interact with each of these with special software programs you use on your computer. The main ones being:

Web Browser

When viewing the web you use a web browser like Internet Explorer. Many web hosting companies provide a ?Control Panel? to administer your web host account, which you use with your web browser. Most allow you to configure most aspects of your account using a simple web browser.

Web site/page editor

Today many web servers allow editing of WebPages over HTTP (hypertext transfer protocol) based on Microsoft FrontPage technology. These special editors allow you to essentially look at your web site as if you were using a web browser and edit the pages directly as you see them using WYSWIG (What you see if what you get) technology. Most web hosting environments support this, and if you are starting out, make sure it is available. One tip: make sure the web host providing this really does understand this technology ? it is the main area of which many hacks and security intrusions occur.

FTP Client

This is a very simple piece of software that allows you to view the server folders and files in your web host account as if they were files and folders on your own computer. You can then drag and drop files between you computer and your web host account.

Email Client

If you are on the internet you would already be using an email client to send and receive your email. The most common are Outlook Express, Eudora and Web based mail clients like Hotmail.

Database Administration Client

The most common databases used with web servers are Microsoft SQL Server (available only on Windows) and MySQL (commonly found on Linux and UNIX but also available on Windows). SQL Server comes with it's own administration client where you can view your databases, edit them, backup data and do all the administration functions you need. MySQL has an active online community where there is a range of administration clients available.

Choosing a web host is, again, similar to choosing a house to live in or commercial premises to do business. You need to define what it is you require: how much space you need and what features and facilities you need.

If you have been reading this article because this is new to you, then it is likely at this stage you only need minimal space and basic facilities. Once you have worked with the basic facilities you will learn more and become aware of greater facilities and features and then you can simple move from one web ?hosting environment to another ? paying more or paying less. Moving in cyberspace is much easier, faster, and more seamless than physically moving house or commercial premises.

Initially you may use the web-hosting environment offered by your ISP (internet Service provider), the company you use to connect to the internet. But remember these companies main business is connecting many thousands of people to the internet ? not managing web hosting environments. You will generally find they offer less than basic facilities and minimal space.

If you are just starting out with your first web site the first major choice you will be faced with is ?Unix? or ?Windows?. For a person just starting out on the internet, both are equally capable and will offer the facilities you need to have your place in cyberspace.

If you have a web designer or technical person to help you, you only need to consider how much space you really need. With this simple idea in mind, when you are just starting out, owning your piece of cyberspace will not cost anymore than $8 per month. Many web-hosting companies will offer what you need for as little as $3 per month (usually paid yearly).

If you are going alone and doing it all yourself you may want to consider an account with a web hosting company that offers and prides itself on it's support and customer service, 24/7 support access and the experience, knowledge and skill of it's server administrators. Remember, these are the gardeners and the guards who take care of your environment.

Web hosting is very simple and straightforward an once you obtain your space in cyberspace you will never want to let it go and you can easily move it where you want as a turtle carries it's shell on it's back. Always remember you are not stuck in the first web-hoisting environment you choose.

Web hosting isyour space in cyberspace and it is imperative to have a place in cyberspace in our modern society, just as it is to have an office to do business. Justify Full

Saturday, January 2, 2010

Marketing Plan Outline

I. Executive Summary

A high-level summary of the marketing plan.


II. The Challenge

Brief description of product to be marketed and associated goals, such as sales figures and strategic goals.


III. Situation Analysis

Company Analysis

Customer Analysis

  • Number
  • Type
  • Value drivers
  • Decision process
  • Concentration of customer base for particular products

Competitor Analysis

  • Market position
  • Strengths
  • Weaknesses
  • Market shares

Collaborators

  • Subsidiaries, joint ventures, and distributors, etc.

Climate

Macro-environmental PEST analysis :

  • Political and legal environment
  • Economic environment
  • Social and cultural environment
  • Technological environment

SWOT Analysis

A SWOT analysis of the business environment can be performed by organizing the environmental factors as follows:

  • The firm's internal attributes can be classed as strengths and weaknesses.
  • The external environment presents opportunities and threats.

IV. Market Segmentation

Present a description of the market segmentation as follows:

Segment 1
  • Description
  • Percent of sales
  • What they want
  • How they use product
  • Support requirements
  • How to reach them
  • Price sensitivity

Segment 2
.
.
.


V. Alternative Marketing Strategies

List and discuss the alternatives that were considered before arriving at the recommended strategy. Alternatives might include discontinuing a product, re-branding, positioning as a premium or value product, etc.


VI. Selected Marketing Strategy

Discuss why the strategy was selected, then the marketing mix decisions (4 P's) of product, price, place (distribution), and promotion.

Product

The product decisions should consider the product's advantages and how they will be leveraged. Product decisions should include:

  • Brand name
  • Quality
  • Scope of product line
  • Warranty
  • Packaging

Price

Discuss pricing strategy, expected volume, and decisions for the following pricing variables:

  • List price
  • Discounts
  • Bundling
  • Payment terms and financing options
  • Leasing options

Distribution (Place)

Decision variables include:

  • Distribution channels, such as direct, retail, distributors & intermediates
  • Motivating the channel - for example, distributor margins
  • Criteria for evaluating distributors
  • Locations
  • Logistics, including transportation, warehousing, and order fulfilment

Promotion

  • Advertising, including how much and which media.
  • Public relations
  • Promotional programs
  • Budget; determine break-even point for any additional spending
  • Projected results of the promotional programs

VII. Short & Long-Term Projections

The selected strategy's immediate effects, expected long-term results, and any special actions required to achieve them. This section may include forecasts of revenues and expenses as well as the results of a break-even analysis.


VIII. Conclusion

Summarize all of the above.


Saturday, December 19, 2009

Sensex India: Stock Market Today

Sensex down by 174.42 points: Nifty loses 54 points

Mumbai, Dec 18 (UNI) The Sensex of the Bombay Stock Exchange today crashed by 174.42 points to settle in the red at 16,719.83, while the Nifty index of the National Stock Exchange moved below the 5k mark to a two-week low of 4,987.70 with a loss of 54.05 points, weighed down by speculation that the central bank would tighten the monetary policy to help stem rising prices.

The yield on the 10-year benchmark bond rose to 7.7 pc, matching a 13-month high hit on December 11 2009. The 10-year bond yield had ended at 7.64 per cent on December 17, 2009.

Sell-off was seen across all the sectors in late trade, barring pharma and auto. Realty, oil & gas, banking and FMCG were the major losers.

However, Tata Motors, TCS, HCL Tech, Wipro, Sun Pharma, Ranbaxy, Hero Honda and Cipla were the only gainers. The markets were in a consolidation mode till 1400 hrs and traded in a tight range of 5,010-5,060.

The BSE Sensex was down 201.19 points or 1.19 per cent, off close to 205 points from the day's high. Two index heavyweights, Reliance Industries (RIL) and ICICI Bank, slumped and FMCG, banking and realty stocks fell. The market breadth turned weak in contrast to a strong breadth earlier in the day, brokers said.

Intraday volatility was high. The market cut losses soon after an early slide. It came off the higher level later. The market recovered from lower level after hitting a fresh intraday low in morning trade. The market slumped, reversing course after moving into positive zone from negative zone for a short in afternoon trade. The market extended losses in late trade with the Sensex ending at the lowest level of the day.

European equities drifted higher, with stronger energy shares on the back of firmer crude oil prices outpacing a weaker financials. Asian stocks fell on concerns that banks will need to raise more equity and FedEx Corp forecast profit that missed analysts' estimates.

The BSE Sensex resumed down 38.34 points to 16,855.91. It rose 4.94 points at the day's high of 16,899.19 in afternoon trade.

The S&P CNX Nifty of NSE opened flat at 5042.00 and then recorded the day's high and low at 5043.40 points and 4,979.05 respectively.

On BSE, 1125 shares advanced as compared with 1681 that declined. A total of 99 shares remained unchanged. Among the 30-member Sensex pack, 24 fell, while the rest rose.

The key BSE indices plunged with top Realty index down by 2.06 epr cent to settle at 3708.76 pts, Oil & Gas index by 1.74 pc to 9945 pts, FMCG index by 1.23 pc to 2755.94 pts, Bankex index by 1.22 pc to 9542.94 pts and PSU index by 1.02 pc to 9083.13 pts.

However, a few leading indices gained as HC index was up by 1.32 pc to 5117.57 pts, CD index by 0.53 pc to 3530.78 pts and Auto index by 0.27 pc to 7214.52 pts.

RIL crashed by 2.28 per cent to close at Rs 1,010.45, leading the top losers in Group A on BSE at the end of the session. Among the other heavyweight losers were Sterlite Ind, which was down by 2.03 per cent to Rs 818.05, followed by ICICI Bank by 2.02 per cent to Rs 808.80, DLF Ltd by 1.97 per cent to Rs 358.15 and Bharti Airtel by 1.89 per cent to Rs 317.10.

However, the key shares that gained included Tata Motors, up by 3.16 per cent to Rs 732.75, Sun Pharma by 1.12 per cent to Rs 1,497.85 and TCS by 0.67 per cent to Rs 727.50).

In the midcap space, Havells India was up 13.29 per cent and Bayer Cropscience rose 10.59 pc. Bajaj Holdings, Deccan Chronicle and Sterlite Tech were up 5-6.6 pc.

However, HT Media, Jagran Prakashan, KGN Industries, Gammon India and Bajaj Finserv fell 4-5 pc.

In the smallcap space, Elder Pharma, Panoramic Universal, Sadbhav Engg and Advanta gained 7.5-10.5 pc. However, RSWM, Cranes Software, Kwality Dairy, Sanghi Ind and Rain Commodities lost 4.5-5 pc.

High valuations worry investors, India down

Barring a few, most major indices across the world saw declines this week. India too, unfortunately found itself amongst the losers. India's benchmark index, the BSE-Sensex ended the week lower by 2.3%. This, after a subdued performance last week to when the index saw an almost flattish performance. The recent dull performance of the markets here in India come at a time when concerns about high valuations are taking centre stage.

As far as global markets are concerned, the German markets led the gains this week, with its index ending higher by about 1.3%. It was followed by Japan and Singapore, which ended marginally higher by about 0.3% and 0.1% respectively. Japanese markets were propped up by banking stocks in the country, which rose on the optimism that they'll have at least a decade to implement stricter capital rules. The Chinese and Brazilian markets saw the biggest declines this week, falling by a hefty 4.1% and 3.6% each. The fall in China was led by stocks of real estate developers in the country on concerns that the nation will step up measures to curb property speculation.

Source: Yahoo Finance


Coming to the performance of BSE indices, pharma stocks were in favour this week as the BSE-Healthcare index ended higher by about 3.8%. It was followed by the BSE-IT index which recorded gains of about 3% after gaining 2.2% in the previous week too. However, the list of loser far outstripped the sectoral indices that saw gains. Banking stocks were the worst affected by the selling. The BSE Banking index lost 5.6% this week. Expectations are on a rise that the RBI will raise interest rates soon to tame rising inflation. This is what possibly hurt banking stocks during the week. Pressure on bank stocks is simply because higher interest rates from the RBI will mean higher cost of funds for banks. This would subsequently force them to raise their own interest costs thereby leading to a possible decline in credit offtake. The losses of the BSE Banking index were closely followed by the BSE Realty and BSE Oil & Gas stocks which lost 5.5% and 4.1% respectively. Defensive FMCG stocks too took a hit with the BSE FMCG index seeing declines of 3.3% during the week.

Source: BSE


Moving on to the key corporate developments during the week, in an unexpected move, telecom regulator TRAI is planning change the rules in the telecom industry, wherein operators would have to start presenting a business case each time they come out with a tariff package. Only once the regulator is convinced the new tariffs are profitable would they be approved. This is in contrast to the status quo in the past wherein operators did not require prior approval for tariff packages, but were left to market forces. As per a leading business publication, TRAI has already begun work on examining tariff packages and the regulator will soon invite companies to present their business case. It may be noted that the exercise will also cover existing tariff packages. TRAI is doing this with the intention of ensuring the long term health of the telecom sector and its attractiveness to investors. This will come as relief to established players like Bharti Airtel who have been nervous about the predatory pricing that many new entrants in the industry have resorted to.

Steel giant SAIL during the week asked the government to levy anti-dumping duty to curb cheap steel imports at a time when profits are under pressure due to falling prices. Earlier, the steel ministry had requested the finance ministry for a 10% duty on steel imports, which was turned down. The imports come from China and Ukraine at US$ 400 per tonne at a time when rates are US$ 500 to US$ 550 per tonne in India. Given the global overcapacity situation in the sector, we believe the Indian steel makers will have to lobby hard to insulate themselves from low prices. It may be noted that even if the quantity of import is not significant, import prices set the benchmark for the industry.

Cement major ACC said that it does not expect any slowdown in the demand for the commodity on account of prospective rollback of government stimulus. It may be noted that due to the cut on excise duty, cement companies were able to save Rs 4 to 5 per bag which was passed on to the customer. However as the government might roll back these excise cuts in the next Union Budget, the price of cement and related products are expected to move northward. However, ACC does not expect this to impact the retail demand for the cement. It is for this reason it plans to invest Rs 15 bn in capex during 2010 especially in its readymade concrete (RMC) segment which mainly caters to the Indian real estate sector. The company will be expanding the capacity at its Karnataka (Wadi) plant from 5.8 mt to 8.8 mt by April 2010.

The buoyancy in the IT sector during the week seemed a result of strong economic data coming out from the country these IT majors get their maximum revenues from, the US. As per reports, retail sales came in stronger than expected in the US and consumer sentiment also showed a significant improvement on a month on month basis. It should be noted that consumer spending accounts for nearly 2/3rd of the US GDP and hence, positive reports on this front does raise expectations a great deal of a economic recovery in the US and thus, higher sales for Indian IT companies. Furthermore, a strong US economy also means a stronger dollar, another positive factor for Indian IT companies.

Infosys, India's second largest IT services exporter is considering prospects of a joint venture with the IT arm of German engineering major Siemens AG. If the deal with Infosys goes through, it will help the Indian IT major to boost its revenues from the European markets. The company has already hinted that it aimed to increase its revenue contribution from Europe to 40% in the next couple of years. At present it generates over 60% revenue from the US, 25% from the Europe and the remaining comes from rest of the world. The cash rich company has also hinted that it plans to take the inorganic route for gaining strong foothold into the target markets.

Movers and shakers during the week
Company 11-Dec-09 18-Dec-09 Change 52-wk High/Low
Top gainers during the week (BSE-A Group)
Apollo Hospitals 455 565 23.9% 625/350
Bajaj Holdings & Invst. 560 649 16.0% 664/210
Dr. Reddy's 1,113 1,205 8.3% 1,226/357
Asian Paints 1,698 1,800 6.0% 1,811/681
Ultratech Cement 852 900 5.6% 917/325
Top losers during the week (BSE-A Group)
Andhra Bank 119 102 -13.9% 125/37
Rei Agro 50 44 -11.9% 104/38
United Spirits 1,390 1,228 -11.7% 1,415/426
IVRCL Infra 380 337 -11.4% 425/82
IFCI 57 51 -11.2% 61/16
Source: Equitymaster


Bank credit growth stood at 10.5% YoY during the fortnight upto 4th December 2009. This was faster than the credit growth during the previous 3 fortnights. However, the sustainability of this faster pace of credit growth is at question. This is much lower than the RBI's target of around 13% to 14%. It shows that Indian banks are still wary of lending to segments such as personal loans and credit cards. Borrowings from corporate clients too has not picked up a good pace. This is in contrast to the enthusiastic lending by banks to segments such as home loans which have a collateral backing them and are considered more safe. It may be noted that the total outstanding deposits of banks as of the 4th of December grew 18% YoY.

In what might burn a deeper hole in your pocket, India's food price inflation is now nearing 20%. This is as per data compiled by the commerce ministry. It shows that food prices on an average increased by 19.95% during the week ended December 5. This is higher than the 19.05% food price inflation that was recorded in the previous week. The wholesale price index on the other hand more than trebled to 4.8% during November as rising prices of food items like potato, sugar and pinched consumers in a big way. This led the investors to speculate that a rate hike or a liquidity tightening measure could be in the offing, which in turn could also apply brakes to the Indian GDP growth.

But as unpredictable as macroeconomic developments have shown themselves to be, it would probably be wisest for an investor in stocks to devote as little time as possible in anticipating such events. And least of all, make their investment decisions on the basis of these anticipations. Spotting and investing in a company that has show for many years past that it can navigate such macroeconomic vagaries with ease, and is available at fair or attractive valuations is the best bet an investor can have.

Sunday, December 13, 2009

Trading characteristics

Most traded currencies[2]
Currency distribution of reported FX market turnover
Rank Currency ISO 4217 code
(Symbol)
% daily share
(April 2007)
1 United States United States dollar USD ($) 86.3%
2 European Union Euro EUR (€) 37.0%
3 Japan Japanese yen JPY (¥) 17.0%
4 United Kingdom Pound sterling GBP (£) 15.0%
5 Switzerland Swiss franc CHF (Fr) 6.8%
6 Australia Australian dollar AUD ($) 6.7%
7 Canada Canadian dollar CAD ($) 4.2%
8-9 Sweden Swedish krona SEK (kr) 2.8%
8-9 Hong Kong Hong Kong dollar HKD ($) 2.8%
10 Norway Norwegian krone NOK (kr) 2.2%
11 New Zealand New Zealand dollar NZD ($) 1.9%
12 Mexico Mexican peso MXN ($) 1.3%
13 Singapore Singapore dollar SGD ($) 1.2%
14 South Korea South Korean won KRW (₩) 1.1%
Other 14.5%
Total 200%

There is no unified or centrally cleared market for the majority of FX trades, and there is very little cross-border regulation. Due to the over-the-counter (OTC) nature of currency markets, there are rather a number of interconnected marketplaces, where different currencies instruments are traded. This implies that there is not a single exchange rate but rather a number of different rates (prices), depending on what bank or market maker is trading, and where it is. In practice the rates are often very close, otherwise they could be exploited by arbitrageurs instantaneously. Due to London's dominance in the market, a particular currency's quoted price is usually the London market price. A joint venture of the Chicago Mercantile Exchange and Reuters, called Fxmarketspace opened in 2007 and aspired but failed to the role of a central market clearing mechanism.

The main trading center is London, but New York, Tokyo, Hong Kong and Singapore are all important centers as well. Banks throughout the world participate. Currency trading happens continuously throughout the day; as the Asian trading session ends, the European session begins, followed by the North American session and then back to the Asian session, excluding weekends.

Fluctuations in exchange rates are usually caused by actual monetary flows as well as by expectations of changes in monetary flows caused by changes in gross domestic product (GDP) growth, inflation (purchasing power parity theory), interest rates (interest rate parity, Domestic Fisher effect, International Fisher effect), budget and trade deficits or surpluses, large cross-border M&A deals and other macroeconomic conditions. Major news is released publicly, often on scheduled dates, so many people have access to the same news at the same time. However, the large banks have an important advantage; they can see their customers' order flow.

Currencies are traded against one another. Each pair of currencies thus constitutes an individual product and is traditionally noted XXXYYY or YYY/XXX, where YYY is the ISO 4217 international three-letter code of the currency into which the price of one unit of XXX is expressed (called base currency). For instance, EURUSD or USD/EUR is the price of the euro expressed in US dollars, as in 1 euro = 1.5465 dollar. Out of convention, the first currency in the pair, the "base" currency, was the stronger currency at the creation of the pair. The second currency, counter currency or "term" currency, was the weaker currency at the creation of the pair. Currencies are occasionally incorrectly quoted with the pairs inverted e.g. EUR/USD but this is incorrect. The "/" acts the same as the divide mathematical operator and derives the actual exchange rate. e.g. an amount of $140,000 equates to €100,000. $140,000/€100,000 = $/€ = USD/EUR = a rate of 1.4 hence EURUSD or USD/EUR. See Exchange_rate

The factors affecting XXX will affect both XXXYYY and XXXZZZ. This causes positive currency correlation between XXXYYY and XXXZZZ.

On the spot market, according to the BIS study, the most heavily traded products were:

  • EURUSD: 27%
  • USDJPY: 13%
  • GBPUSD (also called cable): 12%

and the US currency was involved in 86.3% of transactions, followed by the euro (37.0%), the yen (17.0%), and sterling (15.0%) (see table). Volume percentages for all individual currencies should add up to 200%, as each transaction involves two currencies.

Trading in the euro has grown considerably since the currency's creation in January 1999, and how long the foreign exchange market will remain dollar-centered is open to debate. Until recently, trading the euro versus a non-European currency ZZZ would have usually involved two trades: EURUSD and USDZZZ. The exception to this is EURJPY, which is an established traded currency pair in the interbank spot market. As the dollar's value has eroded during 2008, interest in using the euro as reference currency for prices in commodities (such as oil), as well as a larger component of foreign reserves by banks, has increased dramatically. Transactions in the currencies of commodity-producing countries, such as AUD, NZD, CAD, have also increased.

Market size and liquidity

Main foreign exchange market turnover, 1988 - 2007, measured in billions of USD.

The foreign exchange market is the largest and most liquid financial market in the world. Traders include large banks, central banks, currency speculators, corporations, governments, and other financial institutions. The average daily volume in the global foreign exchange and related markets is continuously growing. Daily turnover was reported to be over US$3.2 trillion in April 2007 by the Bank for International Settlements. [2] Since then, the market has continued to grow. According to Euromoney's annual FX Poll, volumes grew a further 41% between 2007 and 2008.[3]

Of the $3.98 trillion daily global turnover, trading in London accounted for around $1.36 trillion, or 34.1% of the total, making London by far the global center for foreign exchange. In second and third places respectively, trading in New York accounted for 16.6%, and Tokyo accounted for 6.0%.[4] In addition to "traditional" turnover, $2.1 trillion was traded in derivatives.

Exchange-traded FX futures contracts were introduced in 1972 at the Chicago Mercantile Exchange and are actively traded relative to most other futures contracts.

Several other developed countries also permit the trading of FX derivative products (like currency futures and options on currency futures) on their exchanges. All these developed countries already have fully convertible capital accounts. Most emerging countries do not permit FX derivative products on their exchanges in view of prevalent controls on the capital accounts. However, a few select emerging countries (e.g., Korea, South Africa, India—[1]; [2]) have already successfully experimented with the currency futures exchanges, despite having some controls on the capital account.

FX futures volume has grown rapidly in recent years, and accounts for about 7% of the total foreign exchange market volume, according to The Wall Street Journal Europe (5/5/06, p. 20).

Top 10 currency traders [5]
% of overall volume, May 2009
Rank Name Market Share
1 Germany Deutsche Bank 20.96%
2 Switzerland UBS AG 14.58%
3 United Kingdom Barclays Capital 10.45%
4 United Kingdom Royal Bank of Scotland 8.19%
5 United States Citi 7.32%
6 United States JPMorgan 5.43%
7 United Kingdom HSBC 4.09%
8 United States Goldman Sachs 3.35%
9 Switzerland Credit Suisse 3.05%
10 France BNP Paribas 2.26%

Foreign exchange trading increased by 38% between April 2005 and April 2006 and has more than doubled since 2001. This is largely due to the growing importance of foreign exchange as an asset class and an increase in fund management assets, particularly of hedge funds and pension funds. The diverse selection of execution venues have made it easier for retail traders to trade in the foreign exchange market. In 2006, retail traders constituted over 2% of the whole FX market volumes with an average daily trade volume of over US$50-60 billion (see retail trading platforms).[6] Because foreign exchange is an OTC market where brokers/dealers negotiate directly with one another, there is no central exchange or clearing house. The biggest geographic trading centre is the UK, primarily London, which according to IFSL estimates has increased its share of global turnover in traditional transactions from 31.3% in April 2004 to 34.1% in April 2007. The ten most active traders account for almost 80% of trading volume, according to the 2008 Euromoney FX survey.[3] These large international banks continually provide the market with both bid (buy) and ask (sell) prices. The bid/ask spread is the difference between the price at which a bank or market maker will sell ("ask", or "offer") and the price at which a market taker will buy ("bid") from a wholesale or retail customer. The customer will buy from the market-maker at the higher "ask" price, and will sell at the lower "bid" price, thus giving up the "spread" as the cost of completing the trade. This spread is minimal for actively traded pairs of currencies, usually 0–3 pips. For example, the bid/ask quote of EUR/USD might be 1.2200/1.2203 on a retail broker. Minimum trading size for most deals is usually 100,000 units of base currency, which is a standard "lot".

These spreads might not apply to retail customers at banks, which will routinely mark up the difference to say 1.2100/1.2300 for transfers, or say 1.2000/1.2400 for banknotes or travelers' checks. Spot prices at market makers vary, but on EUR/USD are usually no more than 3 pips wide (i.e., 0.0003). Competition is greatly increased with larger transactions, and pip spreads shrink on the major pairs to as little as 1 to 2 pips.